
Value-based care (VBC) economics hinge on a deceptively simple idea: align payment with performance. Instead of rewarding volume, contracts now reward outcomes—lower total cost of care (TCOC), higher quality, fewer avoidable events. Yet when margins depend on managing utilization and variation, understanding the economics behind TCOC becomes essential. AI has emerged as the new differentiator—giving leaders predictive visibility, prioritization, and control at the population level.
Every value-based contract can be read like a profit-and-loss statement. Benchmarks define what an “average” member should cost. Medical Loss Ratio (MLR) shows how efficiently care dollars are spent. Shared savings, or losses, reflect whether the organization delivered care below or above benchmark—adjusted for quality performance and risk coding accuracy.
Financial performance depends on managing three levers:
Trend factors (e.g., national cost growth) inflate future benchmarks; performance corridors cap extreme gains or losses; and stop-loss coverage shields from catastrophic claims. Knowing how these interact lets organizations model realistic savings targets and negotiate protection. The economics of risk aren’t abstract—they dictate cash flow, reserves, and reinvestment capacity.
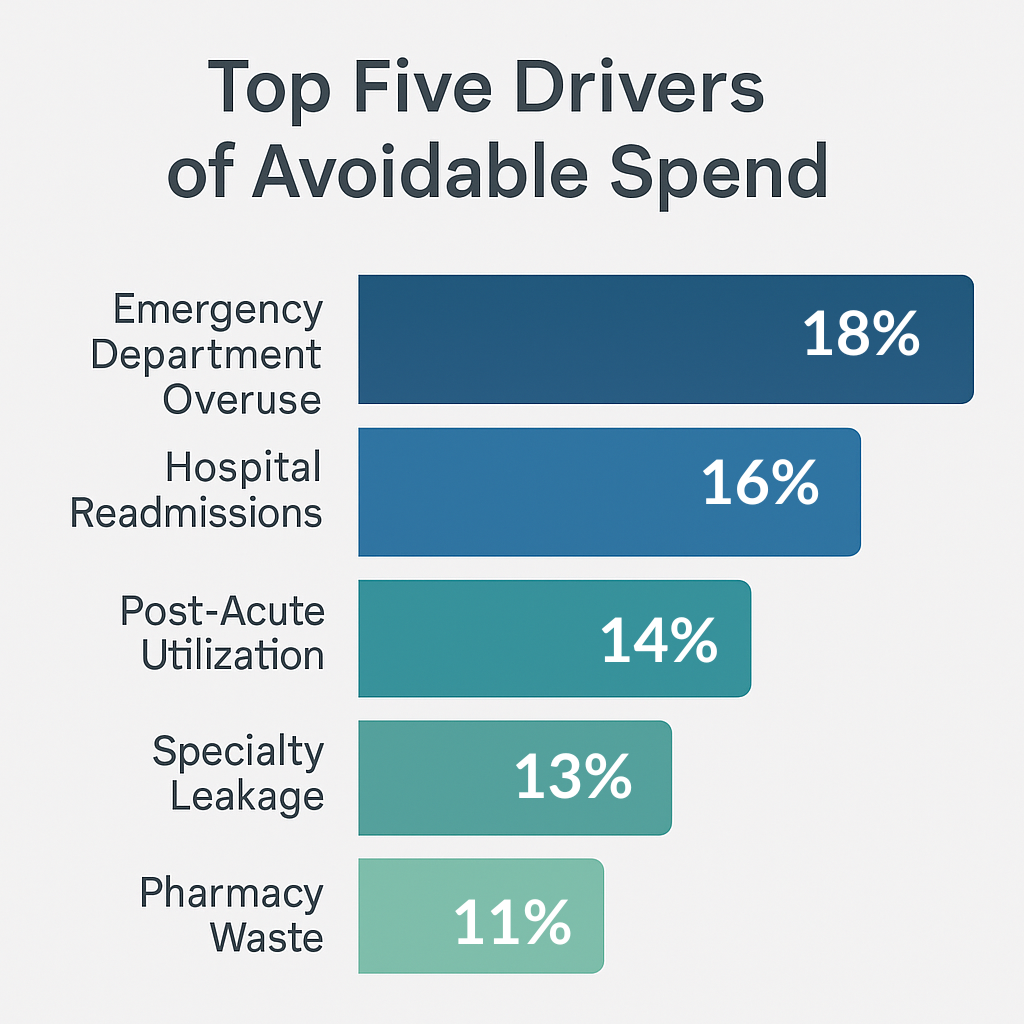
Roughly 70% of avoidable spend lives in five categories: emergency department (ED) overuse, hospital readmissions, post-acute inefficiencies, specialty leakage, and pharmacy waste. Each requires its own data signal and intervention model.
Targeting these categories produces measurable savings within two quarters—an important signal to boards and payers that a VBC program is operationally mature.
Sources: CMS; HHS; MedPAC; AHRQ; AJMC; JAMA (multiple analyses on utilization variation, medication non-adherence, readmissions, and total cost of care)
Artificial intelligence doesn’t replace clinicians—it amplifies them. Deployed correctly, it turns historical data into forward-looking decision support.
Instead of static “high-risk” lists based on last year’s claims, predictive models score members daily using vitals, utilization, and SDOH data. The goal is to identify the 10–15% of the population trending upward before they cross the high-cost threshold. These models guide outreach, care coordination, and home-based interventions that prevent escalation.
Traditional gap lists overwhelm clinicians. AI prioritizes by financial and clinical impact—ranking which closures (e.g., diabetic eye exams, hypertension control) yield the highest reduction in downstream cost. Embedded directly in EHR workflows, it delivers a single “next best action” rather than a static report.
Claims-based intelligence can reveal which specialists deliver the same outcomes at half the cost. By combining predictive modeling with network data, referral tools automatically suggest preferred in-network providers and direct imaging orders from hospital-based to freestanding centers, reducing cost by 20–40% without affecting quality.
AI automates evidence validation, allowing utilization management teams to approve appropriate care faster and deny low-value requests more consistently. That balance—speed and scrutiny—directly improves provider satisfaction and MLR simultaneously.
Start narrow. Choose one population (e.g., attributed Medicare Advantage lives), one cost lever (e.g., readmissions), and one KPI (e.g., admits per 1,000).
Phase 1 – 90 Days:
Phase 2 – 6 Months:
Phase 3 – 12 Months:
Organizations that follow this crawl-walk-run approach typically see 5–10% PMPM reduction in year one, with quality metrics holding steady or improving.
Numbers tell the story. Essential indicators include:
Link each KPI to a financial lever. For example, every 1% increase in generic fill rate saves roughly $4–6 PMPM; every 5% readmission reduction saves $40–60 PMPM. Tracking these metrics creates a clear ROI narrative for boards, investors, or payers evaluating program maturity.
AI-enabled VBC must be governed like a clinical device—transparent, validated, and bias-checked. Governance boards should review model performance quarterly, ensuring predictive accuracy doesn’t erode across subpopulations.
Equity is both ethical and economic. Predictive bias that under-identifies minority or rural populations creates missed savings opportunities and potential compliance exposure. Embedding fairness metrics—such as equal opportunity scores—protects both reputation and margin.
Primary care visits are central to managing rising-risk patients in value-based care.
A 40-provider ACO in the Midwest piloted AI-driven referral steering and readmission prediction for 9,000 Medicare lives. Within six months, average PMPM dropped from $912 to $848—a 7% reduction primarily from redirecting high-cost imaging and reducing 30-day readmits. Shared-savings payouts doubled year-over-year, and clinician adoption climbed to 78% thanks to in-EHR next-best-action prompts.¹
What is Total Cost of Care in VBC?
It’s the all-in per-member spend—hospital, outpatient, post-acute, pharmacy, and ancillary—used as the benchmark for shared savings performance.
How does AI affect shared-savings math?
By preventing avoidable utilization and tightening coding accuracy, AI improves the MLR, expanding the gap between actual spend and benchmark.
Which metrics move first?
Readmission rates, ED utilization, and post-acute days respond quickest to predictive and coordination interventions.
Build or buy AI?
Buy to accelerate learning curves; build only if you control high-volume data and have the capital for model governance and refresh cycles.
Value-based care economics reward precision—knowing exactly where dollars leak and where they can be reclaimed. AI delivers that precision at scale. The organizations that master TCOC today will own the economics of care tomorrow.
Contact us to strengthen VBC performance by capturing accurate risk, closing gaps, and reducing avoidable spend—right from your EHR.
¹ Example drawn from aggregated performance trends among regional ACOs participating in MSSP and MA risk contracts, 2023–2024.